What is the Keltner Channel?
The Keltner Channels were originally developed by market technician Chester Keltner in his 1960 book How to Make Money in Commodities.
In LPQ Strategy you will be educated in our Live Sessions on how to use Keltner Channel
If you are completely new to trading, all you need to do to begin with is to set up your recommended charts with the Keltner Channel overlay
WHICH PLATFORMS OFFER IT?FEATURED IN:

LPQ STRATEGY
What is the Keltner Channel?
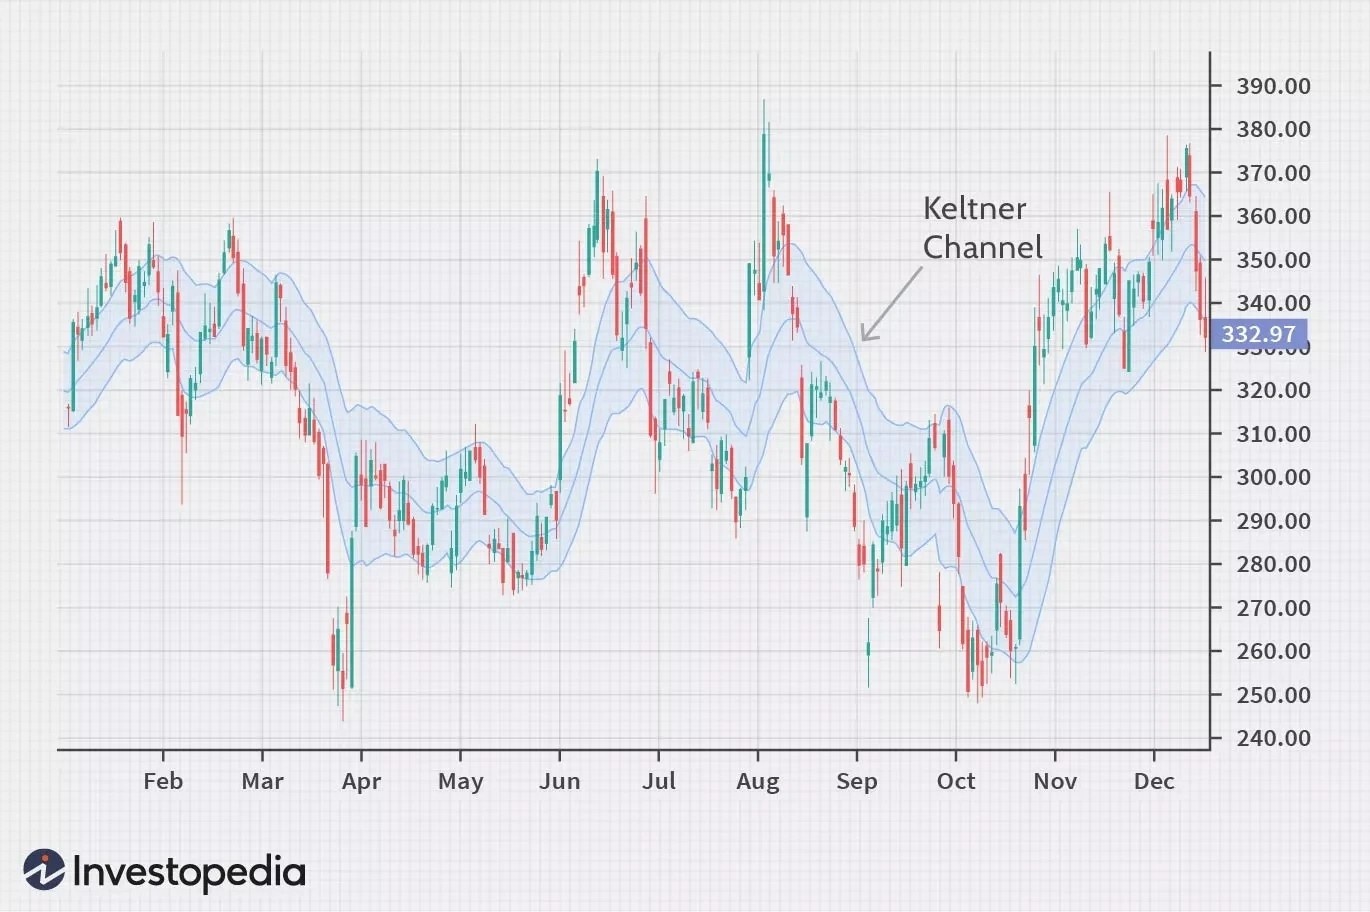
Keltner Channels are volatility-based bands that are placed on either side of an asset's price and can aid in determining the direction of a trend.
The Keltner channel uses the average-true range (ATR) or volatility, with breaks above or below the top and bottom barriers signaling a continuation.
Understanding the Keltner Channel
The Key Points
- The exponential moving average (EMA) of a Keltner Channel is typically 20 periods, although this can be adjusted if desired.
- The upper and lower bands are typically set two times the average true range (ATR) above and below the EMA, although the multiplier can also be adjusted based on personal preference.
- Price reaching the upper Keltner Channel band is bullish, while reaching the lower band is bearish.
- The angle of the Keltner Channel also aids in identifying the trend direction. The price may also oscillate between the upper and lower Keltner Channel bands, which can be interpreted as resistance and support levels.
- A rising channel means the price has been rising, while a falling or sideways channel indicates the price has been falling or moving sideways, respectively.
- A price move above the upper band shows price strength. This is another indication that an uptrend is in play, especially if the channel is angled upwards.
- A drop below the lower band shows price weakness. This is evidence of a downtrend, especially if the channel is angled downward.
- If the price is continually hitting the upper band, but not the lower, when the price does finally reach the lower band it could be a sign that the uptrend is losing momentum.
- If the price is constantly hitting the lower band, but not the upper, when the price does finally reach the upper band it could be a signal that the downtrend is near an end.
- The price may also oscillate between the upper and lower bands. In cases like these, traders may use the bands as support and resistance. They may look to buy when the price reaches the lower band and then starts to move higher again and may look to sell or short after the price starts to fall again after reaching the upper band.
- After a sideways period, if the price breaks above or below the channel and the channel starts to angle the same way, that may signal that a new trend is underway in that breakout direction.
You will be required to use both Keltner Channel & SK Chart overlay
See below which platforms offer both indicators